Back to featured insights
How Does Generative BI Work? A Complete Guide for HK Businesses
What if you could simply ask your data a question and get a clear answer? Learn how Generative BI works and how it helps Hong Kong businesses understand data and make better decisions faster.
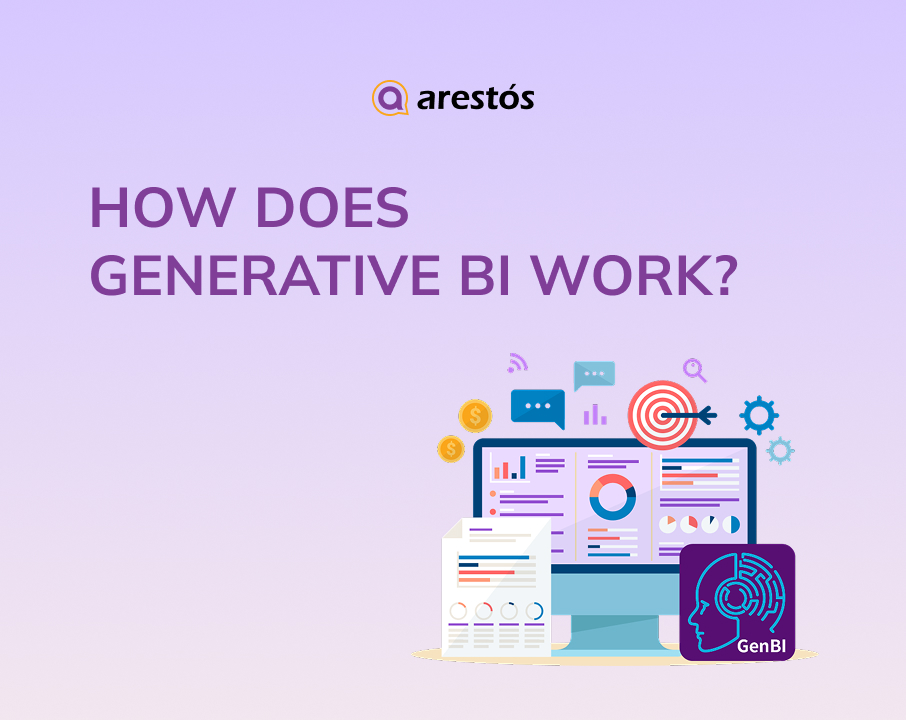
Table of Content
Share
How does Generative BI work? It uses generative AI to turn business data into faster insights, smarter decisions, and more efficient reporting. This guide is for Hong Kong business owners, executives, finance teams, and operations managers looking to make better use of their data. In this guide, we’ll explain how Generative BI works, its key benefits, and what businesses should consider when adopting it.
What Is Generative BI?
Generative BI combines business data, analytics, and generative AI to let users ask questions in natural language and receive data-driven insights, explanations, and reports.
Unlike generic generative AI, Generative BI doesn’t invent data—it interprets and explains your existing business data. It is the next step beyond augmented analytics, moving from AI-assisted BI to conversational, AI-powered business intelligence.
Want to explore the concept in more detail? Read our guide: What Is Generative BI and Why Your Biz Needs It?
Benefits of Generative BI for Hong Kong Businesses
For Hong Kong businesses, Generative BI can make data analysis faster, more accessible, and more actionable across teams:
- Faster decision-making: Get answers to business questions in seconds instead of manually analysing multiple dashboards and reports.
- Greater self-service analytics: Enable executives and teams to explore data without advanced SQL or BI skills.
- More efficient reporting: Automate routine summaries, KPI reports, and data explanations, reducing manual work for finance and operations teams.
- Better data accessibility: Make complex business data easier to understand through natural-language questions and AI-generated insights.
- Improved operational visibility: Quickly identify trends, anomalies, and performance issues across sales, finance, inventory, and operations.
- Scalable analytics: Give more employees access to business intelligence without proportionally increasing the workload of data teams.
How Does Generative BI Work?
It transforms a business question in natural language into a data-backed answer through a sequence of AI, analytics, and data-processing steps. From understanding what the user means to generating a visual explanation, the process typically follows these seven stages.
Natural Language Input
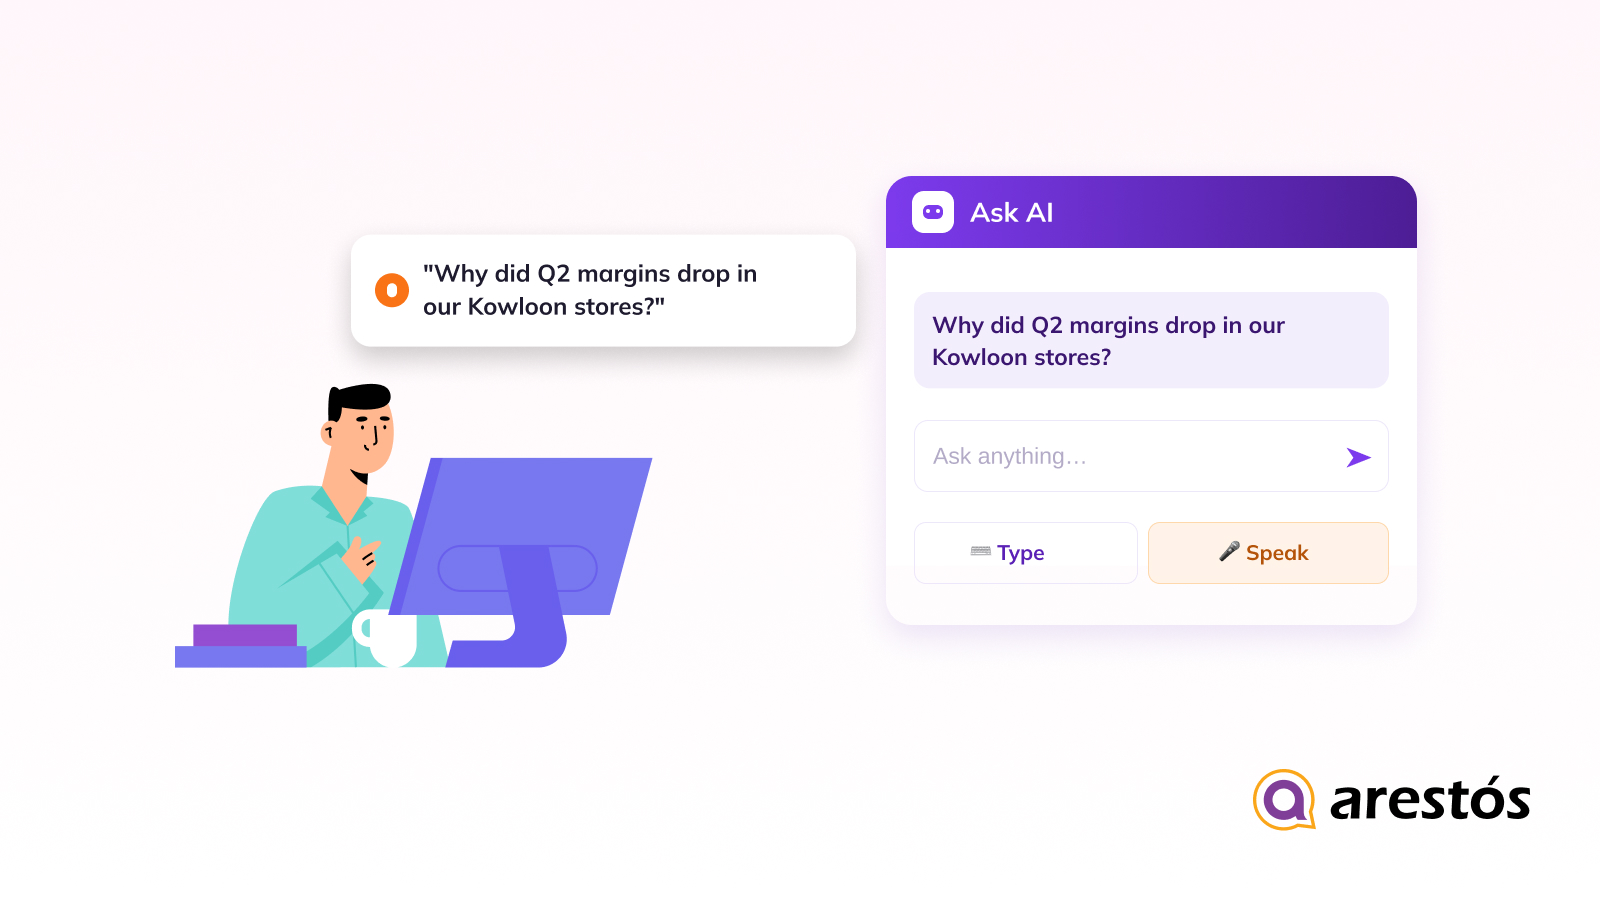
The process starts with a user asking a question in plain English, either by typing or speaking. Unlike traditional BI, users do not need to know SQL, understand database structures, or manually navigate multiple dashboards.
For example: “Why did Q2 margins drop in our Kowloon stores?”
Generative BI breaks this question into business requirements such as:
- Metric: Profit margin
- Time: Q2
- Location: Kowloon stores
- Task: Identify the reason for the decline
This natural language BI approach allows finance teams, executives, and operations managers to interact with data in the same way they would ask a colleague a question.
Intent Parsing & Context Understanding
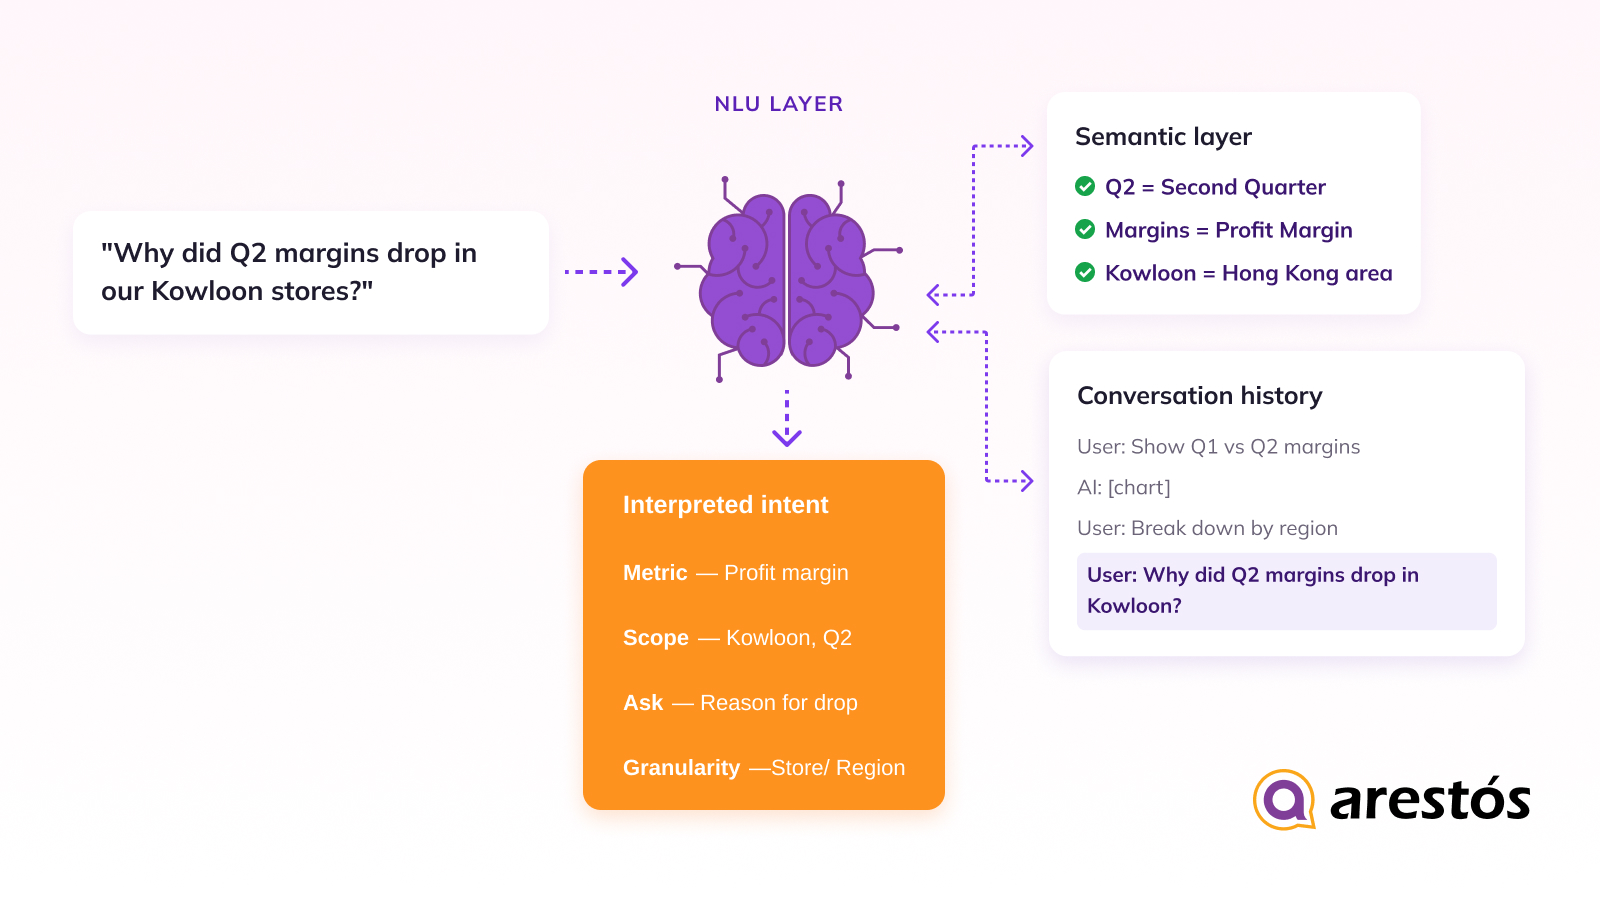
Once the question is received, the system needs to understand what the user actually means. An AI-powered natural language understanding (NLU) layer analyses the question and identifies the relevant business concepts.
It may determine:
- “Margins” → Gross margin
- “Q2” → April–June 2026
- “Kowloon stores” → Stores assigned to the Kowloon region
- “Drop” → Negative change compared with the previous period
The system can also use the semantic layer to understand how the organisation defines metrics and business terms.
Why this matters: The same word can mean different things across businesses. “Revenue,” for example, could refer to gross sales, net sales, or recognised revenue.
Generative BI can also maintain conversational context. If the user follows up with:
“What about Hong Kong Island?”
The system can understand that the user is asking for the same margin analysis for a different location, rather than treating it as an entirely new question.
Automated Query Generation
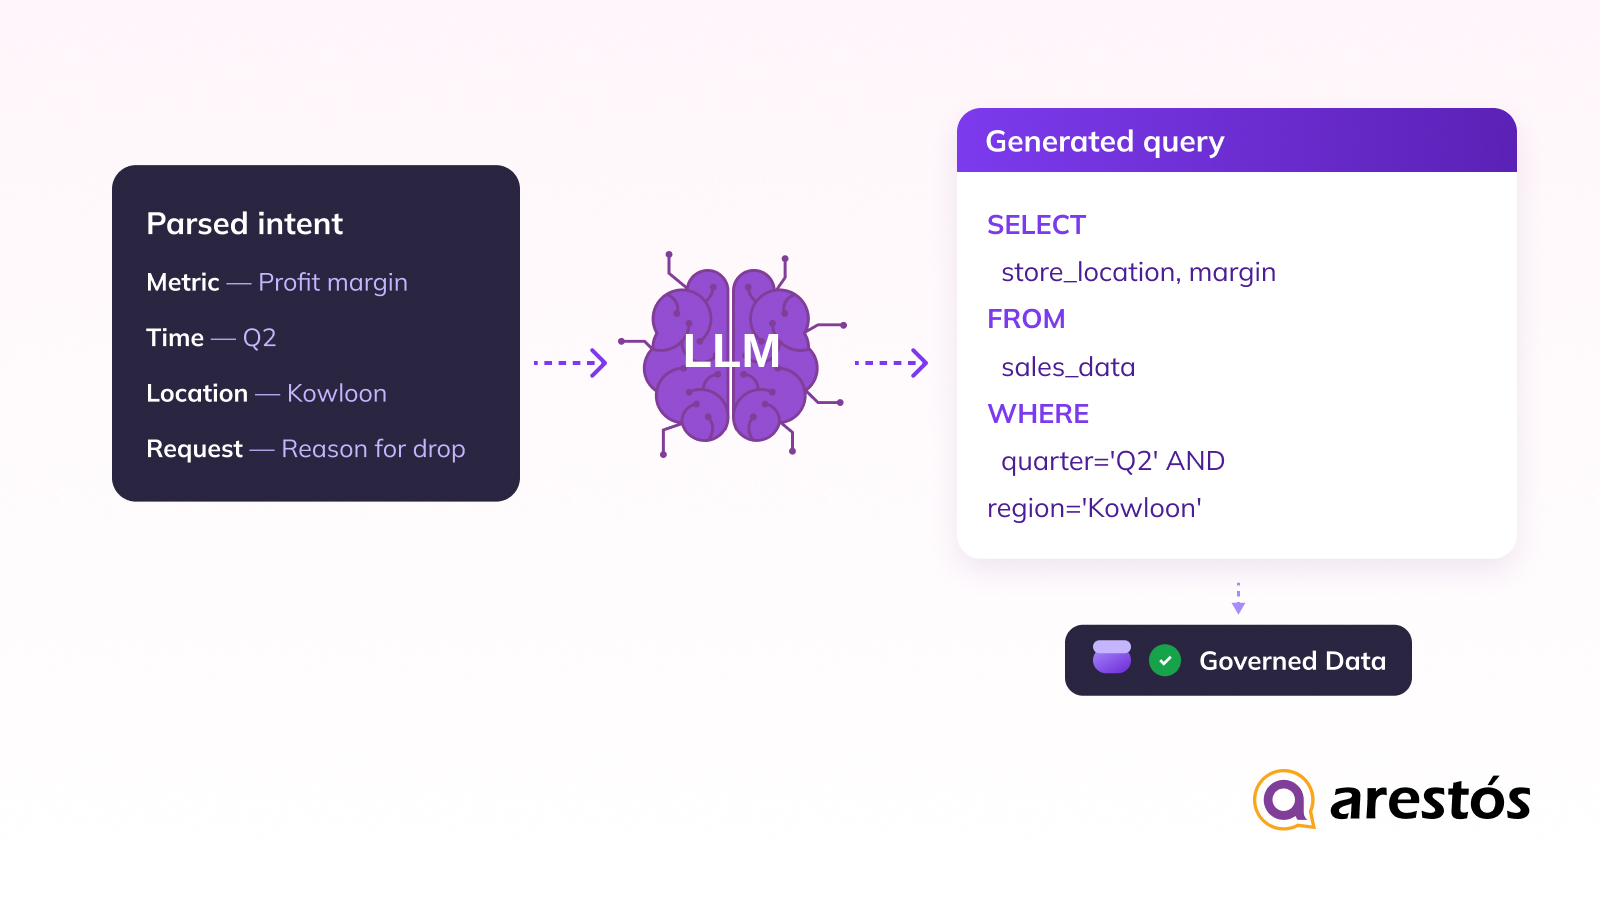
After understanding the intent, the system translates the request into a structured query that can be executed against the underlying data.
Depending on the platform, this may involve:
- Text-to-SQL
- DAX
- Semantic queries
- API calls
- Other analytical query languages
For example:
Natural-language question: “Why did Q2 margins drop in our Kowloon stores?”
AI-generated analytical logic: Compare Q2 gross margin with the previous period → filter Kowloon stores → identify products, costs, or discounts contributing to the change.
The key point is that the LLM is not simply “guessing” an answer. In a well-designed enterprise system, it generates a query or analytical instruction that is then executed against governed business data.
Data Retrieval
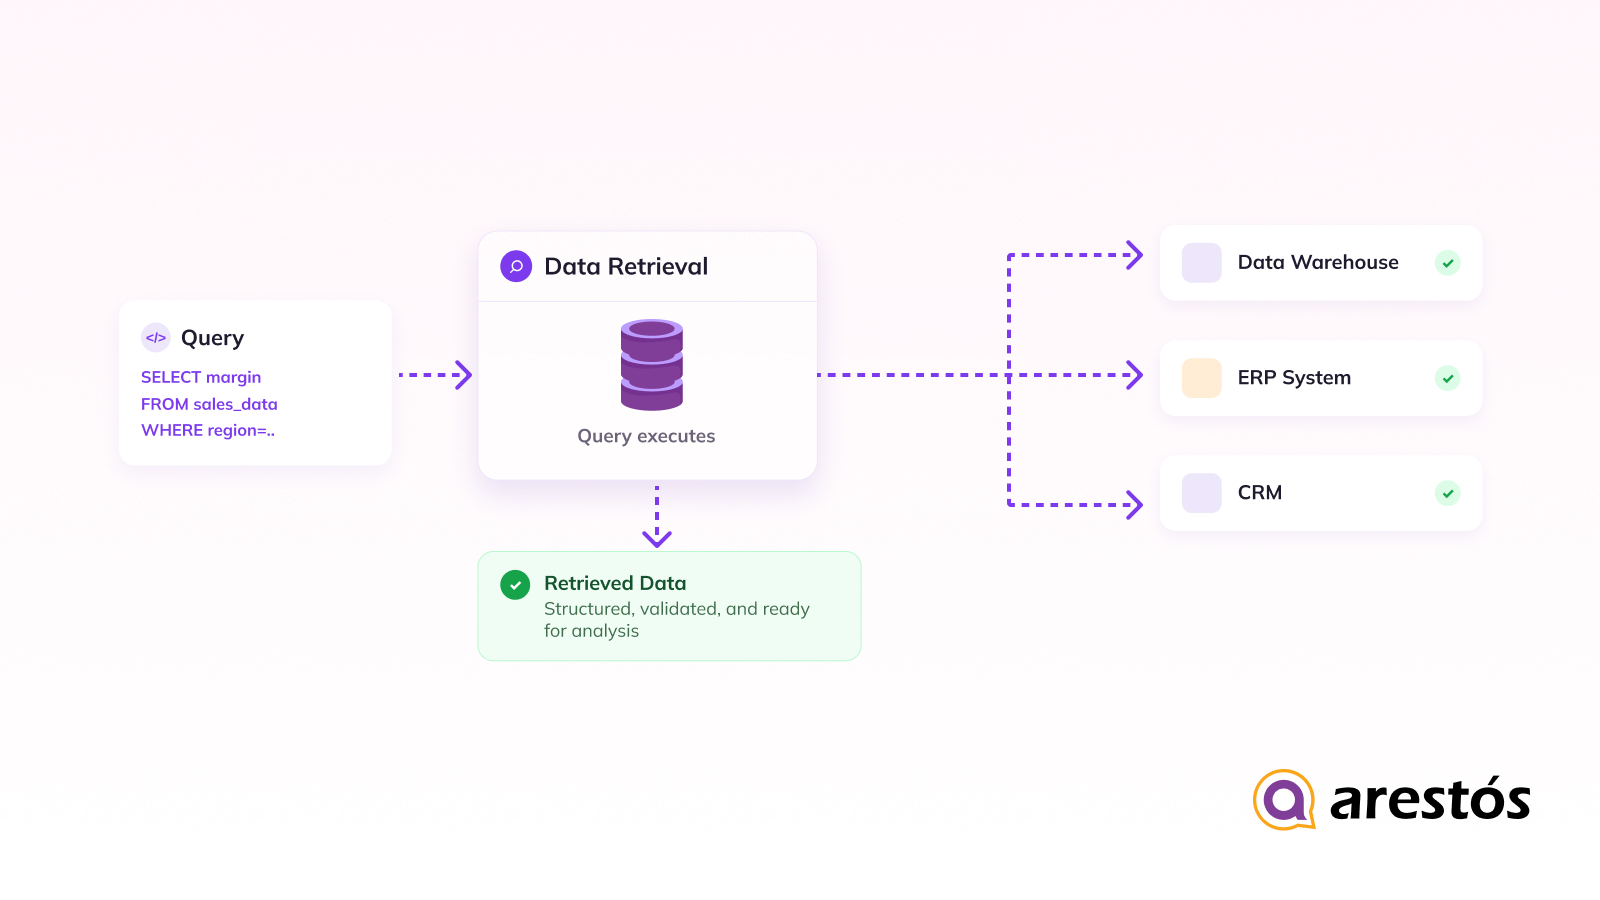
The generated query is then sent to the relevant data sources.
A Generative BI environment may connect to:
- Data warehouses
- ERP systems
- CRM platforms
- Databases
- Cloud applications
- Spreadsheets and other business data sources
For example:
- ERP → Costs & financial data
- CRM → Customer data
- Data warehouse → Consolidated sales data
- E-commerce platform → Online transactions
Platforms such as Snowflake, BigQuery, and SAP can serve as part of this underlying data infrastructure.
The system retrieves only the data needed for the question, subject to the user’s permissions and the organisation’s data-governance rules.
AI Analysis & Pattern Detection
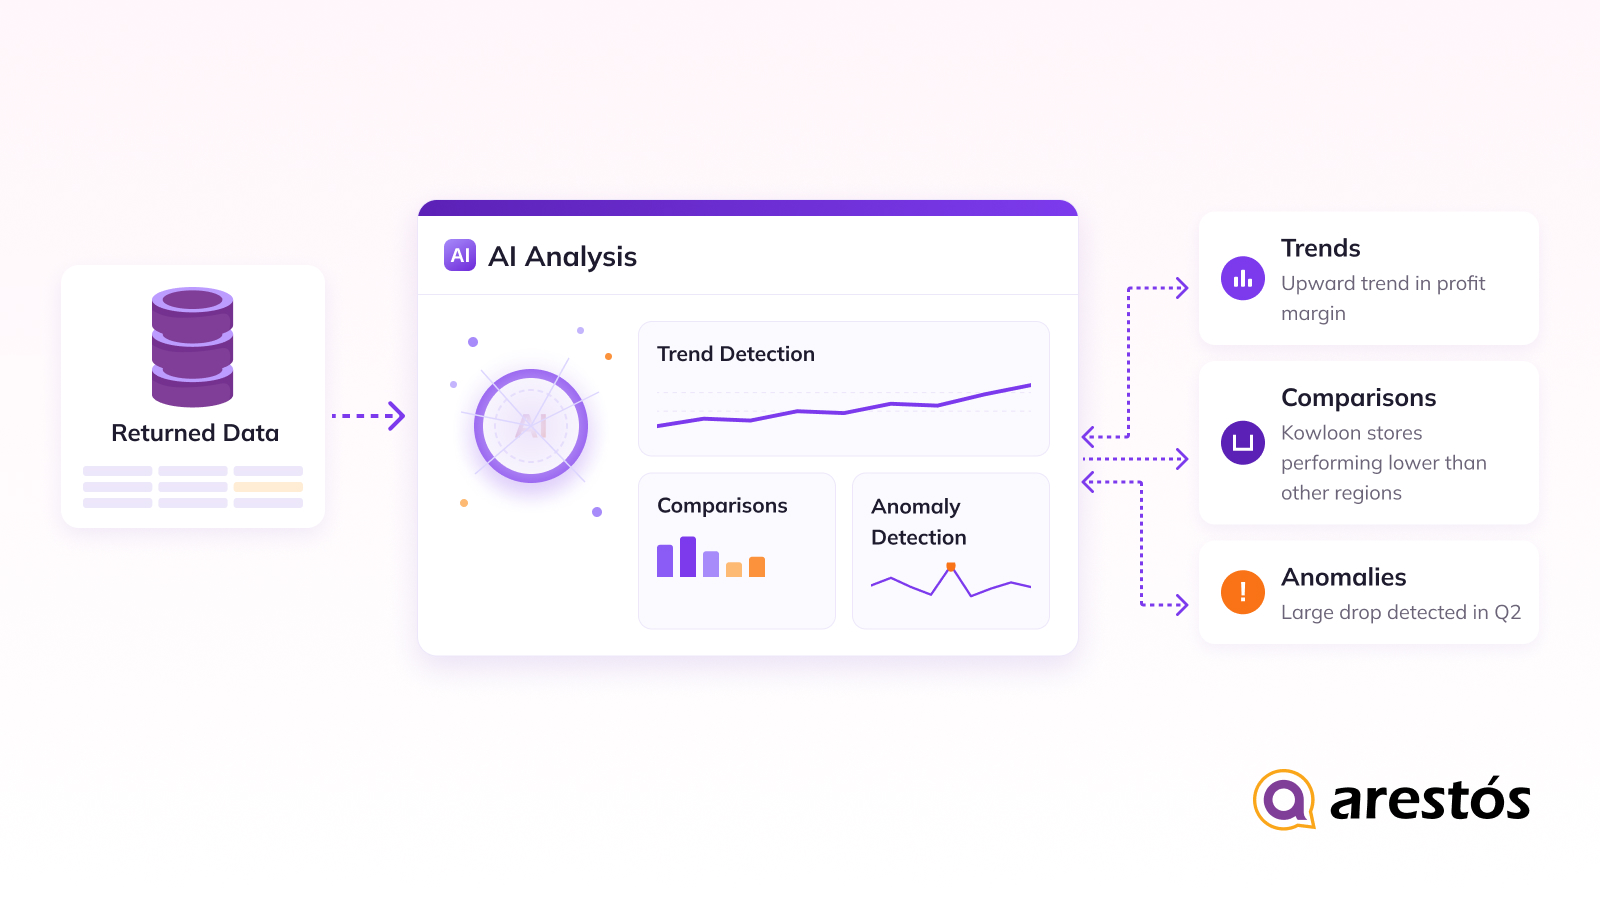
Simply retrieving data is not enough. The next step is to determine what the data is saying.
The analytics layer can examine the results for:
- Trends — Is performance increasing or declining?
- Comparisons — Which period, location, or segment performed better?
- Anomalies — Is something unusually high or low?
- Drivers — What factors contributed most to the change?
- Relationships — Are two variables moving together?
For example, the system might identify:
Q2 gross margin fell 6.8%, primarily due to increased discounting in three Kowloon stores and higher logistics costs for a key product category.
This is where Generative BI moves beyond simply showing data to helping users understand data.
Narrative + Visualization Generation
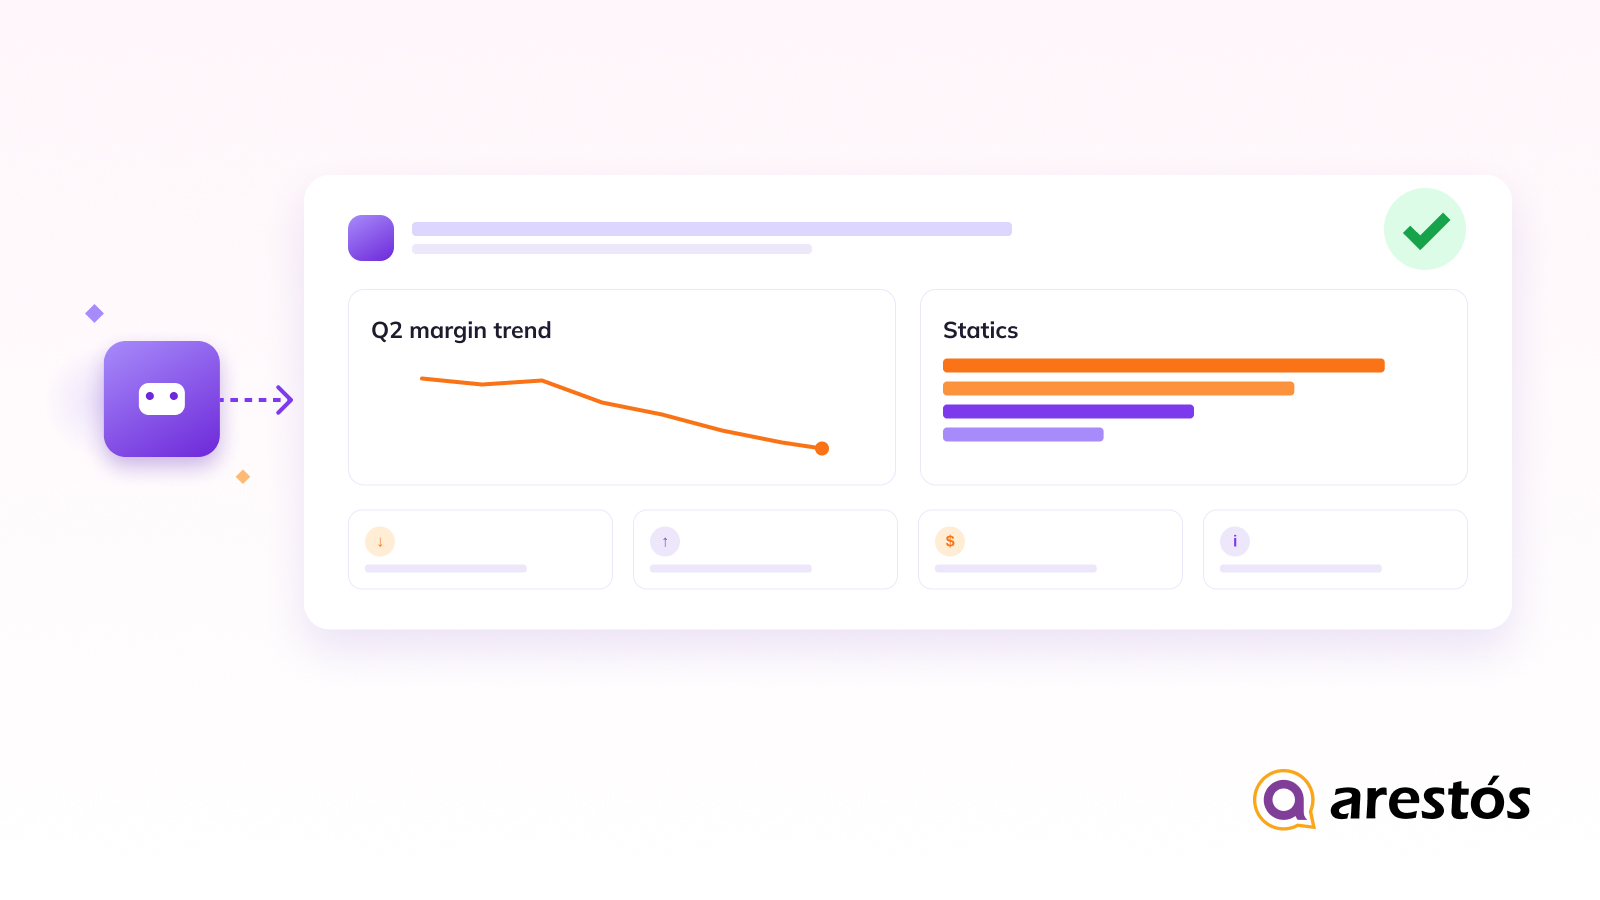
Once the analysis is complete, Generative BI turns the findings into a format that business users can quickly understand.
The output might include:
AI-generated summary: “Gross margin declined 6.8% in Q2, with promotional discounts and higher logistics costs being the main contributors.”
Supporting visualizations:
- Margin by store
- Q1 vs. Q2 margin trend
- Product-level margin changes
The system can automatically select an appropriate format depending on the question:
- “How did revenue change?” → Line chart
- “Which stores performed best?” → Bar chart
- “What caused the decline?” → Driver analysis
- “Summarise this month’s performance.” → Narrative report
- “Show me the top 10 products.” → Ranked table
This makes complex AI data analysis easier to consume, particularly for executives who need the conclusion rather than a spreadsheet full of raw numbers.
Feedback Loop
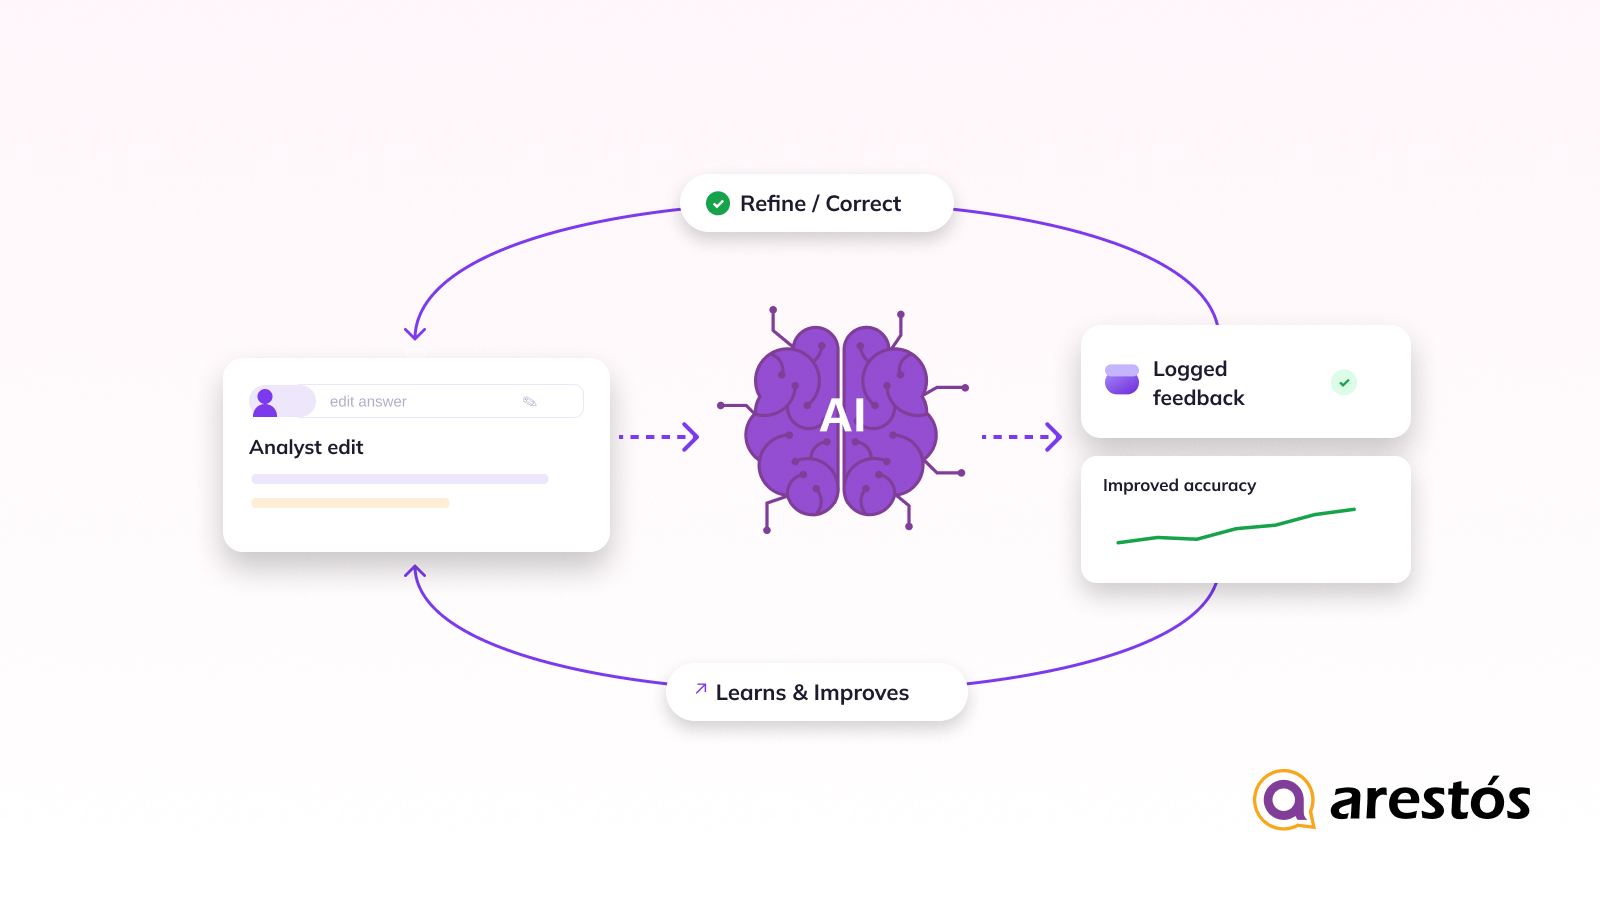
Generative BI does not have to end with the first answer. Users can continue the conversation, ask for clarification, or correct the system.
For example:
User: “Why did Q2 margins drop?”
AI: “The main drivers were higher discounting and logistics costs.”
User: “Exclude promotional sales. What changes?”
The system can use the new instruction as additional context and perform the analysis again.
This creates a continuous loop:
Ask → Analyse → Answer → Refine → Reanalyse
Depending on the platform, user feedback and interaction context can also be used to improve future responses, while enterprise systems should maintain appropriate governance rather than allowing uncontrolled learning from sensitive business data.
The Future of Generative BI: From Answering to Acting
Generative BI is moving beyond answering questions and generating reports. The next phase will focus on turning insights into actions, creating a more proactive and autonomous approach to business intelligence.
- From insights to recommendations: AI will not only explain what happened but also suggest what businesses should do next based on the data.
- From reactive to proactive analytics: Instead of waiting for users to ask questions, AI can continuously monitor business performance and highlight important changes, risks, or opportunities.
- From analysis to automated workflows: Generative BI can increasingly connect insights with business systems to trigger approved actions, such as updating forecasts, sending alerts, or creating tasks.
- More conversational decision-making: Business users will be able to have ongoing conversations with their data, asking follow-up questions and exploring different scenarios before making decisions.
- Stronger AI governance: As AI gains the ability to act, Hong Kong businesses will need clear permissions, data governance, security controls, and human oversight to ensure responsible use.
Frequently Asked Questions
1. Can Generative BI analyse real-time business data?
Yes. Generative BI can analyse real-time or near-real-time data when connected to live data sources.
2. Is Generative BI suitable for small and medium-sized businesses in Hong Kong?
Yes. It can help SMEs automate reporting, access self-service analytics, and make faster data-driven decisions.
3. Is Generative BI accurate?
It can be highly accurate when based on clean, well-governed business data, but important outputs should still be reviewed.
4. What data sources can Generative BI connect to?
It can connect to data warehouses, databases, ERP, CRM, cloud applications, spreadsheets, and other business data sources.
5. Can Generative BI replace data analysts?
No. It automates routine analysis and reporting but supports rather than replaces data analysts.
Conclusion
Generative BI is transforming how businesses interact with data by combining generative AI, analytics, and natural-language interaction. From understanding questions and retrieving data to generating insights and visualizations, it enables Hong Kong businesses to make faster, more informed decisions while reducing manual reporting and analysis.
At Arestós, our Generative BI solutions help businesses turn complex data into accessible, actionable insights. We help integrate AI-powered analytics into your existing data environment, enabling teams to explore data naturally, automate reporting, and support smarter business decisions.
Ready to make your business data work smarter? Contact us today to explore our Generative BI solutions.
Subscribe to our newsletter!
Get updated to
the lastest IT trends
Related Posts
Update the latest technology trends for your business